Analytics
The Analytics page shows how the portal is being used over time, helping administrators understand usage patterns, identify popular cameras, and plan for capacity.
What This Page Does
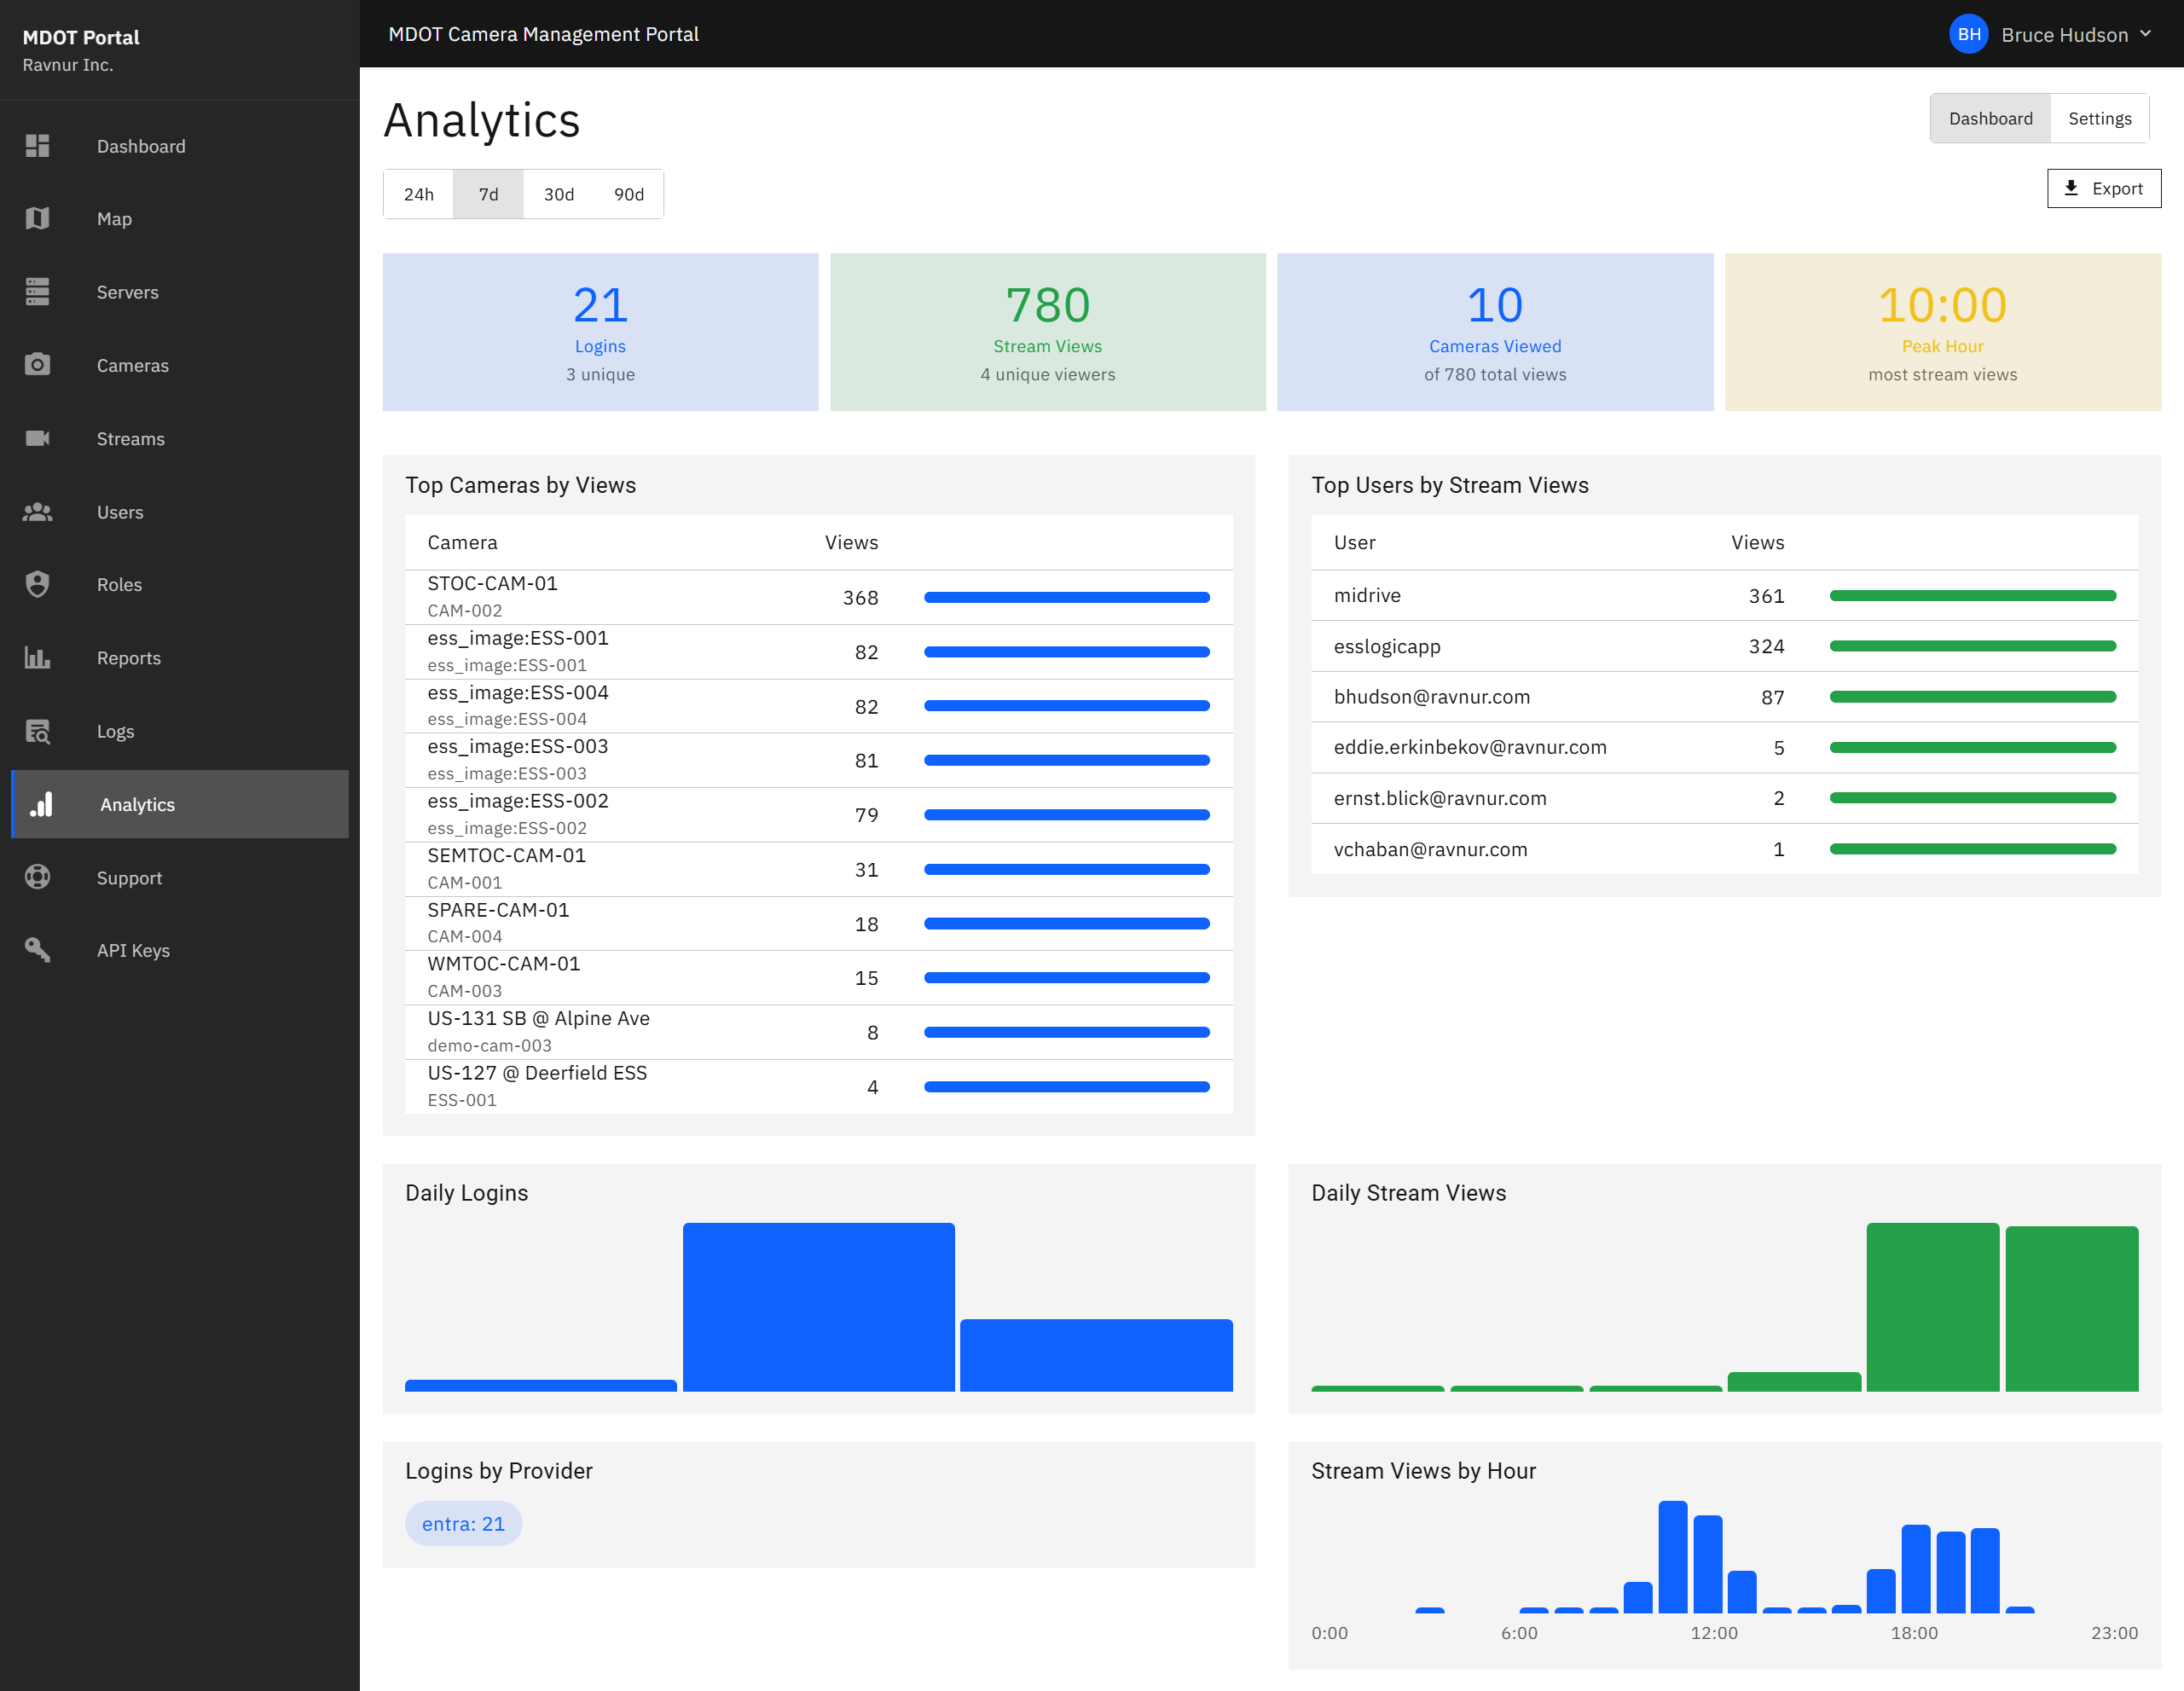
Analytics collects and displays portal usage data in a set of summary cards and charts. You can view trends over configurable time periods ranging from the past 24 hours to the past 90 days. A separate Settings tab lets administrators choose the analytics provider and control which events are tracked.
Key Features
Summary Cards
Four cards at the top of the page give you the headline numbers for the selected time period:
- Total Sign-Ins — The number of times users signed into the portal.
- Stream Views — The total number of times a camera's live feed was opened.
- Unique Viewers — The number of distinct users who viewed at least one camera feed.
- Peak Usage Hour — The hour of the day with the highest combined sign-in and viewing activity.
Top Cameras by Views
A chart showing which cameras are viewed most often. This helps identify high-demand cameras that may need priority maintenance or additional bandwidth.
Top Users
A chart showing which users are most active in the portal. Useful for understanding how the system is being used across your team.
Daily Sign-In and Stream View Trends
A line chart showing day-by-day totals for sign-ins and stream views. Use this to spot trends, seasonal patterns, or unusual spikes in activity.
Hourly Distribution
A chart breaking down activity by hour of the day. This shows when the portal is busiest and can help with scheduling maintenance windows during low-usage periods.
Time Period Selector
A dropdown at the top of the page lets you choose the time period for all charts and cards: 24 hours, 7 days, 30 days, or 90 days.
Settings Tab
The Settings tab allows administrators to configure the analytics provider (Google Analytics or Matomo) and toggle which types of events are tracked. For example, you can enable or disable tracking of page views, stream play events, sign-in events, and report exports.
CSV Export
Click Export CSV to download the analytics data for the selected time period as a spreadsheet file.
How It Works in Practice
- Open the Analytics page from the navigation menu.
- Select a time period from the dropdown (for example, "Last 30 Days").
- Review the summary cards to see overall usage numbers.
- Scroll down to examine the charts for top cameras, top users, daily trends, and hourly patterns.
- Click Export CSV if you need to share the data or include it in a report.
- Use the Settings tab to adjust which events are tracked or to change the analytics provider.