Dashboard
The Dashboard is the first page you see after signing in. It gives you a quick overview of everything happening across the system right now.
What This Page Does
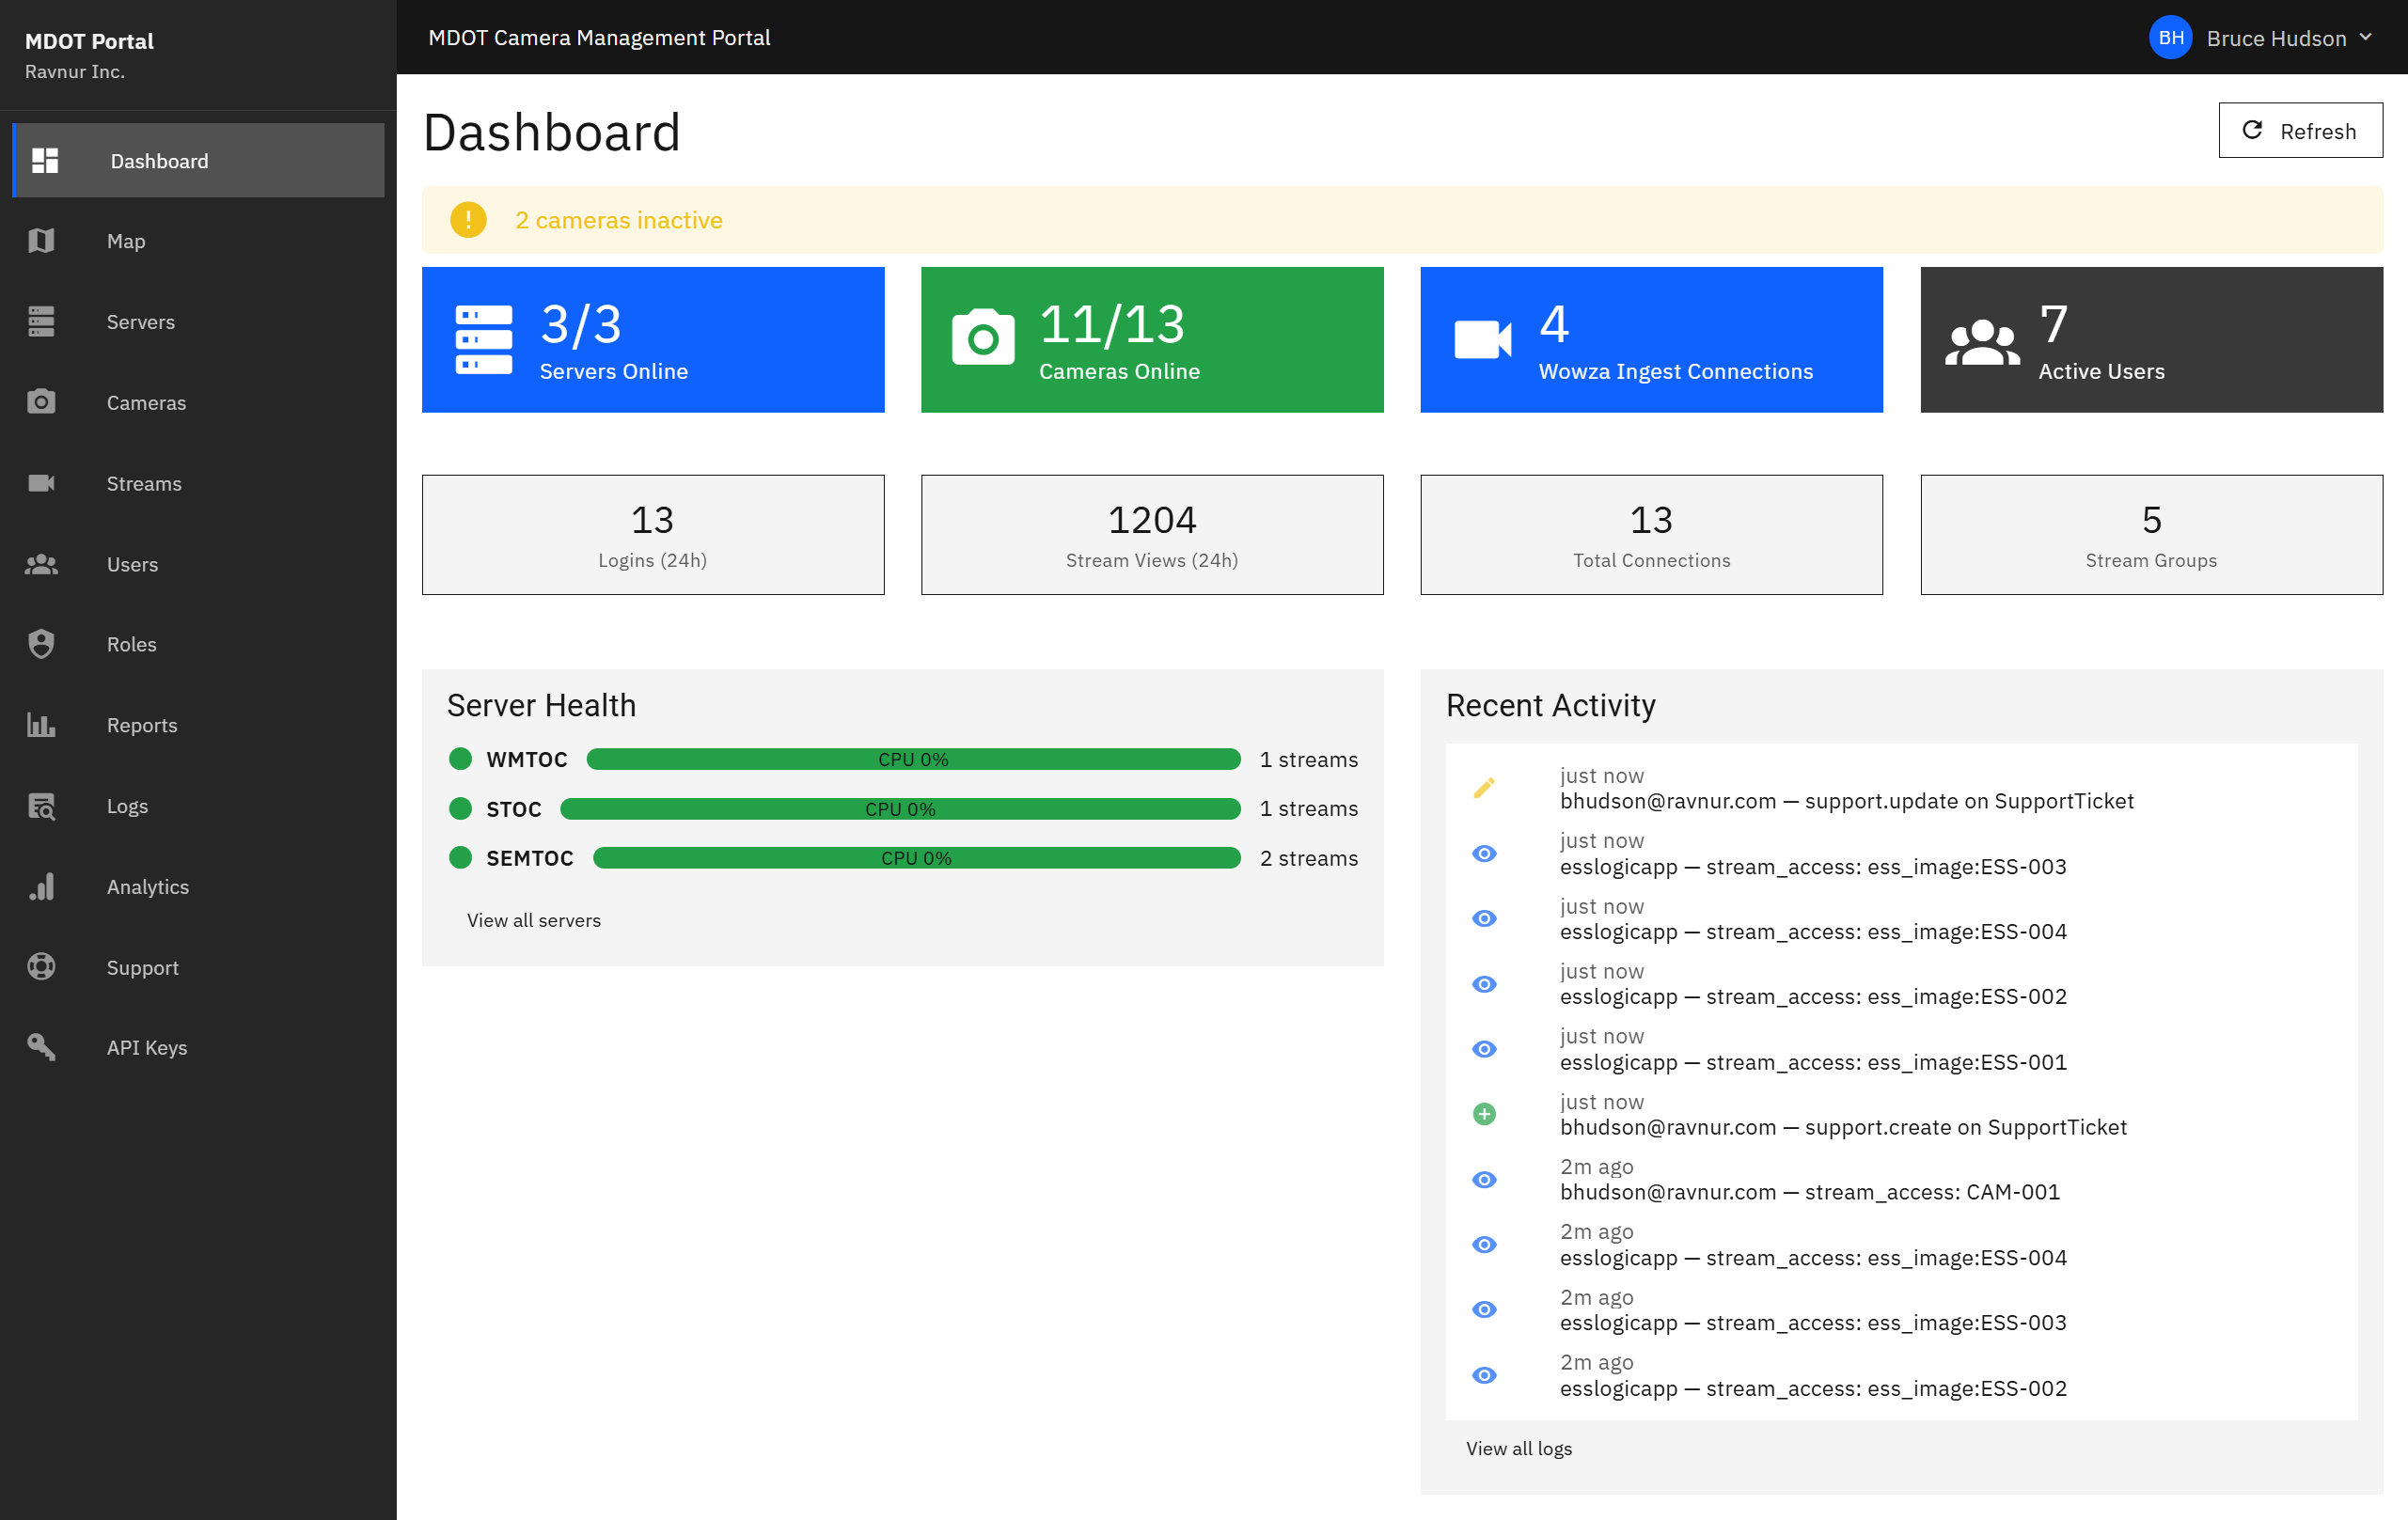
The Dashboard displays a set of summary cards and activity feeds so you can check system health at a glance without opening individual pages. Numbers update automatically every 30 seconds, so the information stays current while you work.
Key Features
Summary Cards
Four cards across the top of the page show the most important numbers:
- Servers Online — How many streaming servers are currently running and responding.
- Cameras Online — How many cameras (CCTV and ESS combined) are currently reporting as online in the portal.
- Wowza Ingest Connections — The total number of live RTSP ingest connections across all Wowza servers — i.e., cameras actively pushing or being pulled by Wowza.
- Active Users — How many portal users are currently signed in.
24-Hour Activity Counts
Below the summary cards, two additional counters show activity over the past 24 hours:
- Logins (24h) — Total sign-in events in the last day.
- Stream Views (24h) — Total times a camera feed was opened by any user.
Server Health Bars
Each streaming server has a health bar showing how much of its capacity is in use. Green means healthy, yellow means the server is under moderate load, and red means it needs attention. If a server goes offline, an alert appears at the top of the page.
Recent Activity Feed
A scrolling list at the bottom of the Dashboard shows the latest actions taken across the portal, such as users signing in, cameras being added, or servers being restarted. This helps administrators stay aware of changes without checking each page individually.
Automatic Alerts
When a server goes offline or a camera stops sending its feed, a warning banner appears near the top of the Dashboard. These alerts stay visible until the issue is resolved or dismissed by an administrator.
How It Works in Practice
- Sign in to the portal. The Dashboard loads automatically.
- Check the summary cards to confirm servers and cameras are operating normally.
- Glance at the server health bars. If any bar is yellow or red, click through to the Servers page for details.
- Review the recent activity feed to see what other team members have been doing.
- If an alert banner appears, follow up on the affected server or camera.
You do not need to refresh the page. All numbers and alerts update automatically every 30 seconds.